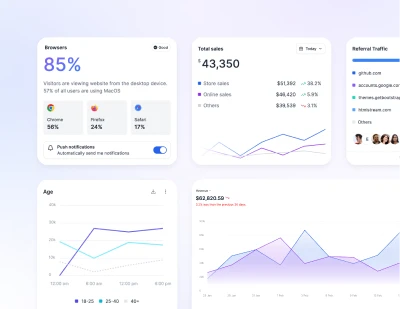
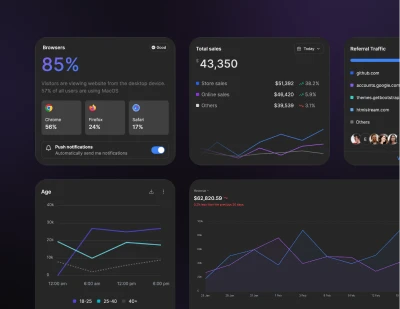
Components
Charts are graphical representations used to showcase and simplify complex data sets, making information more comprehensible and visually appealing. They vary in types-from line to bar to pie-each highlighting specific data patterns and trends.
Note that this component requires the use of the third-party Apexcharts plugin.
Install apexcharts
via npm
npm i apexcharts
Include the CSS <script>
near the end of your </head>
tag:
<link rel="stylesheet" href="./node_modules/apexcharts/dist/apexcharts.css">
Include the JavaScript <script>
near the end of your </body>
tag:
<script src="./node_modules/lodash/lodash.min.js"></script><script src="./node_modules/apexcharts/dist/apexcharts.min.js"></script><script src="https://preline.co/assets/js/hs-apexcharts-helpers.js"></script>
<div id="hs-single-area-chart"></div>
// Apexcharts build helpers
<script src="https://preline.co/assets/js/hs-apexcharts-helpers.js"></script>
<script>
window.addEventListener('load', () => {
(function () {
buildChart('#hs-single-area-chart', (mode) => ({
chart: {
height: 300,
type: 'area',
toolbar: {
show: false
},
zoom: {
enabled: false
}
},
series: [
{
name: 'Visitors',
data: [180, 51, 60, 38, 88, 50, 40, 52, 88, 80, 60, 70]
}
],
legend: {
show: false
},
dataLabels: {
enabled: false
},
stroke: {
curve: 'straight',
width: 2
},
grid: {
strokeDashArray: 2
},
fill: {
type: 'gradient',
gradient: {
type: 'vertical',
shadeIntensity: 1,
opacityFrom: 0.1,
opacityTo: 0.8
}
},
xaxis: {
type: 'category',
tickPlacement: 'on',
categories: [
'25 January 2023',
'26 January 2023',
'27 January 2023',
'28 January 2023',
'29 January 2023',
'30 January 2023',
'31 January 2023',
'1 February 2023',
'2 February 2023',
'3 February 2023',
'4 February 2023',
'5 February 2023'
],
axisBorder: {
show: false
},
axisTicks: {
show: false
},
crosshairs: {
stroke: {
dashArray: 0
},
dropShadow: {
show: false
}
},
tooltip: {
enabled: false
},
labels: {
style: {
colors: '#9ca3af',
fontSize: '13px',
fontFamily: 'Inter, ui-sans-serif',
fontWeight: 400
},
formatter: (title) => {
let t = title;
if (t) {
const newT = t.split(' ');
t = `${newT[0]} ${newT[1].slice(0, 3)}`;
}
return t;
}
}
},
yaxis: {
labels: {
align: 'left',
minWidth: 0,
maxWidth: 140,
style: {
colors: '#9ca3af',
fontSize: '13px',
fontFamily: 'Inter, ui-sans-serif',
fontWeight: 400
},
formatter: (value) => value >= 1000 ? `${value / 1000}k` : value
}
},
tooltip: {
x: {
format: 'MMMM yyyy'
},
y: {
formatter: (value) => `${value >= 1000 ? `${value / 1000}k` : value}`
},
custom: function (props) {
const { categories } = props.ctx.opts.xaxis;
const { dataPointIndex } = props;
const title = categories[dataPointIndex].split(' ');
const newTitle = `${title[0]} ${title[1]}`;
return buildTooltip(props, {
title: newTitle,
mode,
valuePrefix: '',
hasTextLabel: true,
markerExtClasses: '!rounded-sm',
wrapperExtClasses: 'min-w-[120px]'
});
}
},
responsive: [{
breakpoint: 568,
options: {
chart: {
height: 300
},
labels: {
style: {
colors: '#9ca3af',
fontSize: '11px',
fontFamily: 'Inter, ui-sans-serif',
fontWeight: 400
},
offsetX: -2,
formatter: (title) => title.slice(0, 3)
},
yaxis: {
labels: {
align: 'left',
minWidth: 0,
maxWidth: 140,
style: {
colors: '#9ca3af',
fontSize: '11px',
fontFamily: 'Inter, ui-sans-serif',
fontWeight: 400
},
formatter: (value) => value >= 1000 ? `${value / 1000}k` : value
}
},
},
}]
}), {
colors: ['#2563eb', '#9333ea'],
fill: {
gradient: {
stops: [0, 90, 100]
}
},
grid: {
borderColor: '#e5e7eb'
}
}, {
colors: ['#3b82f6', '#a855f7'],
fill: {
gradient: {
stops: [100, 90, 0]
}
},
grid: {
borderColor: '#374151'
}
});
})();
});
</script>
<!-- Legend Indicator -->
<div class="flex justify-center sm:justify-end items-center gap-x-4 mb-3 sm:mb-6">
<div class="inline-flex items-center">
<span class="w-2.5 h-2.5 inline-block bg-blue-600 rounded-sm me-2"></span>
<span class="text-[13px] text-gray-600 dark:text-neutral-400">
Income
</span>
</div>
<div class="inline-flex items-center">
<span class="w-2.5 h-2.5 inline-block bg-purple-600 rounded-sm me-2"></span>
<span class="text-[13px] text-gray-600 dark:text-neutral-400">
Outcome
</span>
</div>
</div>
<!-- End Legend Indicator -->
<div id="hs-multiple-area-charts"></div>
// Apexcharts build helpers
<script src="https://preline.co/assets/js/hs-apexcharts-helpers.js"></script>
<script>
window.addEventListener('load', () => {
(function () {
buildChart('#hs-multiple-area-charts', (mode) => ({
chart: {
height: 300,
type: 'area',
toolbar: {
show: false
},
zoom: {
enabled: false
}
},
series: [
{
name: 'Income',
data: [18000, 51000, 60000, 38000, 88000, 50000, 40000, 52000, 88000, 80000, 60000, 70000]
},
{
name: 'Outcome',
data: [27000, 38000, 60000, 77000, 40000, 50000, 49000, 29000, 42000, 27000, 42000, 50000]
}
],
legend: {
show: false
},
dataLabels: {
enabled: false
},
stroke: {
curve: 'straight',
width: 2
},
grid: {
strokeDashArray: 2
},
fill: {
type: 'gradient',
gradient: {
type: 'vertical',
shadeIntensity: 1,
opacityFrom: 0.1,
opacityTo: 0.8
}
},
xaxis: {
type: 'category',
tickPlacement: 'on',
categories: [
'25 January 2023',
'26 January 2023',
'27 January 2023',
'28 January 2023',
'29 January 2023',
'30 January 2023',
'31 January 2023',
'1 February 2023',
'2 February 2023',
'3 February 2023',
'4 February 2023',
'5 February 2023'
],
axisBorder: {
show: false
},
axisTicks: {
show: false
},
crosshairs: {
stroke: {
dashArray: 0
},
dropShadow: {
show: false
}
},
tooltip: {
enabled: false
},
labels: {
style: {
colors: '#9ca3af',
fontSize: '13px',
fontFamily: 'Inter, ui-sans-serif',
fontWeight: 400
},
formatter: (title) => {
let t = title;
if (t) {
const newT = t.split(' ');
t = `${newT[0]} ${newT[1].slice(0, 3)}`;
}
return t;
}
}
},
yaxis: {
labels: {
align: 'left',
minWidth: 0,
maxWidth: 140,
style: {
colors: '#9ca3af',
fontSize: '13px',
fontFamily: 'Inter, ui-sans-serif',
fontWeight: 400
},
formatter: (value) => value >= 1000 ? `${value / 1000}k` : value
}
},
tooltip: {
x: {
format: 'MMMM yyyy'
},
y: {
formatter: (value) => `$${value >= 1000 ? `${value / 1000}k` : value}`
},
custom: function (props) {
const { categories } = props.ctx.opts.xaxis;
const { dataPointIndex } = props;
const title = categories[dataPointIndex].split(' ');
const newTitle = `${title[0]} ${title[1]}`;
return buildTooltip(props, {
title: newTitle,
mode,
hasTextLabel: true,
wrapperExtClasses: 'min-w-[120px]',
labelDivider: ':',
labelExtClasses: 'ms-2'
});
}
},
responsive: [{
breakpoint: 568,
options: {
chart: {
height: 300
},
labels: {
style: {
colors: '#9ca3af',
fontSize: '11px',
fontFamily: 'Inter, ui-sans-serif',
fontWeight: 400
},
offsetX: -2,
formatter: (title) => title.slice(0, 3)
},
yaxis: {
labels: {
align: 'left',
minWidth: 0,
maxWidth: 140,
style: {
colors: '#9ca3af',
fontSize: '11px',
fontFamily: 'Inter, ui-sans-serif',
fontWeight: 400
},
formatter: (value) => value >= 1000 ? `${value / 1000}k` : value
}
},
},
}]
}), {
colors: ['#2563eb', '#9333ea'],
fill: {
gradient: {
stops: [0, 90, 100]
}
},
grid: {
borderColor: '#e5e7eb'
}
}, {
colors: ['#3b82f6', '#a855f7'],
fill: {
gradient: {
stops: [100, 90, 0]
}
},
grid: {
borderColor: '#374151'
}
});
})();
});
</script>
<!-- Legend Indicator -->
<div class="flex justify-center sm:justify-end items-center gap-x-4 mb-3 sm:mb-6">
<div class="inline-flex items-center">
<span class="w-2.5 h-2.5 inline-block bg-blue-600 rounded-sm me-2"></span>
<span class="text-[13px] text-gray-600 dark:text-neutral-400">
Income
</span>
</div>
<div class="inline-flex items-center">
<span class="w-2.5 h-2.5 inline-block bg-purple-600 rounded-sm me-2"></span>
<span class="text-[13px] text-gray-600 dark:text-neutral-400">
Outcome
</span>
</div>
</div>
<!-- End Legend Indicator -->
<div id="hs-multiple-area-charts-compare-two-tooltip"></div>
// Apexcharts build helpers
<script src="https://preline.co/assets/js/hs-apexcharts-helpers.js"></script>
<script>
window.addEventListener('load', () => {
(function () {
buildChart('#hs-multiple-area-charts-compare-two-tooltip', (mode) => ({
chart: {
height: 300,
type: 'area',
toolbar: {
show: false
},
zoom: {
enabled: false
}
},
series: [
{
name: '2023',
data: [18000, 51000, 60000, 38000, 88000, 50000, 40000, 52000, 88000, 80000, 60000, 70000]
},
{
name: '2022',
data: [27000, 38000, 60000, 77000, 40000, 50000, 49000, 29000, 42000, 27000, 42000, 50000]
}
],
legend: {
show: false
},
dataLabels: {
enabled: false
},
stroke: {
curve: 'straight',
width: 2
},
grid: {
strokeDashArray: 2
},
fill: {
type: 'gradient',
gradient: {
type: 'vertical',
shadeIntensity: 1,
opacityFrom: 0.1,
opacityTo: 0.8
}
},
xaxis: {
type: 'category',
tickPlacement: 'on',
categories: [
'15 January',
'15 February',
'15 March',
'15 April',
'15 May',
'15 June',
'15 July',
'15 August',
'15 September',
'15 October',
'15 November',
'15 December'
],
axisBorder: {
show: false
},
axisTicks: {
show: false
},
crosshairs: {
stroke: {
dashArray: 0
},
dropShadow: {
show: false
}
},
tooltip: {
enabled: false
},
labels: {
style: {
colors: '#9ca3af',
fontSize: '13px',
fontFamily: 'Inter, ui-sans-serif',
fontWeight: 400
},
formatter: (title) => {
let t = title;
if (t) {
const newT = t.split(' ');
t = `${newT[1].slice(0, 3)}`;
}
return t;
}
}
},
yaxis: {
labels: {
align: 'left',
minWidth: 0,
maxWidth: 140,
style: {
colors: '#9ca3af',
fontSize: '13px',
fontFamily: 'Inter, ui-sans-serif',
fontWeight: 400
},
formatter: (value) => value >= 1000 ? `${value / 1000}k` : value
}
},
tooltip: {
x: {
format: 'MMMM yyyy'
},
y: {
formatter: (value) => `$${value >= 1000 ? `${value / 1000}k` : value}`
},
custom: function (props) {
return buildTooltipCompareTwo(props, {
title: 'Revenue',
mode,
hasTextLabel: true,
wrapperExtClasses: 'min-w-[200px]',
markerExtClasses: '!rounded-sm'
});
}
},
responsive: [{
breakpoint: 568,
options: {
chart: {
height: 300
},
labels: {
style: {
colors: '#9ca3af',
fontSize: '11px',
fontFamily: 'Inter, ui-sans-serif',
fontWeight: 400
},
offsetX: -2,
formatter: (title) => title.slice(0, 3)
},
yaxis: {
labels: {
align: 'left',
minWidth: 0,
maxWidth: 140,
style: {
colors: '#9ca3af',
fontSize: '11px',
fontFamily: 'Inter, ui-sans-serif',
fontWeight: 400
},
formatter: (value) => value >= 1000 ? `${value / 1000}k` : value
}
},
},
}]
}), {
colors: ['#2563eb', '#9333ea'],
fill: {
gradient: {
stops: [0, 90, 100]
}
},
grid: {
borderColor: '#e5e7eb'
}
}, {
colors: ['#3b82f6', '#a855f7'],
fill: {
gradient: {
stops: [100, 90, 0]
}
},
grid: {
borderColor: '#374151'
}
});
})();
});
</script>
<!-- Legend Indicator -->
<div class="flex justify-center sm:justify-end items-center gap-x-4 mb-3 sm:mb-6">
<div class="inline-flex items-center">
<span class="w-2.5 h-2.5 inline-block bg-blue-600 rounded-sm me-2"></span>
<span class="text-[13px] text-gray-600 dark:text-neutral-400">
Income
</span>
</div>
<div class="inline-flex items-center">
<span class="w-2.5 h-2.5 inline-block bg-purple-600 rounded-sm me-2"></span>
<span class="text-[13px] text-gray-600 dark:text-neutral-400">
Outcome
</span>
</div>
</div>
<!-- End Legend Indicator -->
<div id="hs-multiple-area-charts-compare-two-tooltip-alt"></div>
// Apexcharts build helpers
<script src="https://preline.co/assets/js/hs-apexcharts-helpers.js"></script>
<script>
window.addEventListener('load', () => {
(function () {
buildChart('#hs-multiple-area-charts-compare-two-tooltip-alt', (mode) => ({
chart: {
height: 300,
type: 'area',
toolbar: {
show: false
},
zoom: {
enabled: false
}
},
series: [
{
name: '2023',
data: [18000, 51000, 60000, 38000, 88000, 50000, 40000, 52000, 88000, 80000, 60000, 70000]
},
{
name: '2022',
data: [27000, 38000, 60000, 77000, 40000, 50000, 49000, 29000, 42000, 27000, 42000, 50000]
}
],
legend: {
show: false
},
dataLabels: {
enabled: false
},
stroke: {
curve: 'straight',
width: 2
},
grid: {
strokeDashArray: 2
},
fill: {
type: 'gradient',
gradient: {
type: 'vertical',
shadeIntensity: 1,
opacityFrom: 0.1,
opacityTo: 0.8
}
},
xaxis: {
type: 'category',
tickPlacement: 'on',
categories: [
'15 January',
'15 February',
'15 March',
'15 April',
'15 May',
'15 June',
'15 July',
'15 August',
'15 September',
'15 October',
'15 November',
'15 December'
],
axisBorder: {
show: false
},
axisTicks: {
show: false
},
crosshairs: {
stroke: {
dashArray: 0
},
dropShadow: {
show: false
}
},
tooltip: {
enabled: false
},
labels: {
style: {
colors: '#9ca3af',
fontSize: '13px',
fontFamily: 'Inter, ui-sans-serif',
fontWeight: 400
},
formatter: (title) => {
let t = title;
if (t) {
const newT = t.split(' ');
t = `${newT[1].slice(0, 3)}`;
}
return t;
}
}
},
yaxis: {
labels: {
align: 'left',
minWidth: 0,
maxWidth: 140,
style: {
colors: '#9ca3af',
fontSize: '13px',
fontFamily: 'Inter, ui-sans-serif',
fontWeight: 400
},
formatter: (value) => value >= 1000 ? `${value / 1000}k` : value
}
},
tooltip: {
x: {
format: 'MMMM yyyy'
},
y: {
formatter: (value) => `$${value >= 1000 ? `${value / 1000}k` : value}`
},
custom: function (props) {
return buildTooltipCompareTwoAlt(props, {
title: 'Spend per customer',
mode,
valuePrefix: 'US$',
hasTextLabel: true,
wrapperExtClasses: 'min-w-[200px]',
markerExtClasses: '!rounded-sm'
});
}
},
responsive: [{
breakpoint: 568,
options: {
chart: {
height: 300
},
labels: {
style: {
colors: '#9ca3af',
fontSize: '11px',
fontFamily: 'Inter, ui-sans-serif',
fontWeight: 400
},
offsetX: -2,
formatter: (title) => title.slice(0, 3)
},
yaxis: {
labels: {
align: 'left',
minWidth: 0,
maxWidth: 140,
style: {
colors: '#9ca3af',
fontSize: '11px',
fontFamily: 'Inter, ui-sans-serif',
fontWeight: 400
},
formatter: (value) => value >= 1000 ? `${value / 1000}k` : value
}
},
},
}]
}), {
colors: ['#2563eb', '#9333ea'],
fill: {
gradient: {
stops: [0, 90, 100]
}
},
grid: {
borderColor: '#e5e7eb'
}
}, {
colors: ['#3b82f6', '#a855f7'],
fill: {
gradient: {
stops: [100, 90, 0]
}
},
grid: {
borderColor: '#374151'
}
});
})();
});
</script>
Use curve: 'smooth'
to make the chart lines curved.
<!-- Legend Indicator -->
<div class="flex justify-center sm:justify-end items-center gap-x-4 mb-3 sm:mb-6">
<div class="inline-flex items-center">
<span class="w-2.5 h-2.5 inline-block bg-blue-600 rounded-sm me-2"></span>
<span class="text-[13px] text-gray-600 dark:text-neutral-400">
Income
</span>
</div>
<div class="inline-flex items-center">
<span class="w-2.5 h-2.5 inline-block bg-purple-600 rounded-sm me-2"></span>
<span class="text-[13px] text-gray-600 dark:text-neutral-400">
Outcome
</span>
</div>
</div>
<!-- End Legend Indicator -->
<div id="hs-curved-area-charts"></div>
// Apexcharts build helpers
<script src="https://preline.co/assets/js/hs-apexcharts-helpers.js"></script>
<script>
window.addEventListener('load', () => {
(function () {
buildChart('#hs-curved-area-charts', (mode) => ({
chart: {
height: 300,
type: 'area',
toolbar: {
show: false
},
zoom: {
enabled: false
}
},
series: [
{
name: 'Income',
data: [18000, 51000, 60000, 38000, 88000, 50000, 40000, 52000, 88000, 80000, 60000, 70000]
},
{
name: 'Outcome',
data: [27000, 38000, 60000, 77000, 40000, 50000, 49000, 29000, 42000, 27000, 42000, 50000]
}
],
legend: {
show: false
},
dataLabels: {
enabled: false
},
stroke: {
curve: 'smooth',
width: 2
},
grid: {
strokeDashArray: 2
},
fill: {
type: 'gradient',
gradient: {
type: 'vertical',
shadeIntensity: 1,
opacityFrom: 0.1,
opacityTo: 0.8
}
},
xaxis: {
type: 'category',
tickPlacement: 'on',
categories: [
'25 January 2023',
'26 January 2023',
'27 January 2023',
'28 January 2023',
'29 January 2023',
'30 January 2023',
'31 January 2023',
'1 February 2023',
'2 February 2023',
'3 February 2023',
'4 February 2023',
'5 February 2023'
],
axisBorder: {
show: false
},
axisTicks: {
show: false
},
crosshairs: {
stroke: {
dashArray: 0
},
dropShadow: {
show: false
}
},
tooltip: {
enabled: false
},
labels: {
style: {
colors: '#9ca3af',
fontSize: '13px',
fontFamily: 'Inter, ui-sans-serif',
fontWeight: 400
},
formatter: (title) => {
let t = title;
if (t) {
const newT = t.split(' ');
t = `${newT[0]} ${newT[1].slice(0, 3)}`;
}
return t;
}
}
},
yaxis: {
labels: {
align: 'left',
minWidth: 0,
maxWidth: 140,
style: {
colors: '#9ca3af',
fontSize: '13px',
fontFamily: 'Inter, ui-sans-serif',
fontWeight: 400
},
formatter: (value) => value >= 1000 ? `${value / 1000}k` : value
}
},
tooltip: {
x: {
format: 'MMMM yyyy'
},
y: {
formatter: (value) => `$${value >= 1000 ? `${value / 1000}k` : value}`
},
custom: function (props) {
const { categories } = props.ctx.opts.xaxis;
const { dataPointIndex } = props;
const title = categories[dataPointIndex].split(' ');
const newTitle = `${title[0]} ${title[1]}`;
return buildTooltip(props, {
title: newTitle,
mode,
hasTextLabel: true,
wrapperExtClasses: 'min-w-[120px]',
labelDivider: ':',
labelExtClasses: 'ms-2'
});
}
},
responsive: [{
breakpoint: 568,
options: {
chart: {
height: 300
},
labels: {
style: {
colors: '#9ca3af',
fontSize: '11px',
fontFamily: 'Inter, ui-sans-serif',
fontWeight: 400
},
offsetX: -2,
formatter: (title) => title.slice(0, 3)
},
yaxis: {
labels: {
align: 'left',
minWidth: 0,
maxWidth: 140,
style: {
colors: '#9ca3af',
fontSize: '11px',
fontFamily: 'Inter, ui-sans-serif',
fontWeight: 400
},
formatter: (value) => value >= 1000 ? `${value / 1000}k` : value
}
},
},
}]
}), {
colors: ['#2563eb', '#9333ea'],
fill: {
gradient: {
stops: [0, 90, 100]
}
},
grid: {
borderColor: '#e5e7eb'
}
}, {
colors: ['#3b82f6', '#a855f7'],
fill: {
gradient: {
stops: [100, 90, 0]
}
},
grid: {
borderColor: '#374151'
}
});
})();
});
</script>
<div id="hs-single-bar-chart"></div>
// Apexcharts build helpers
<script src="https://preline.co/assets/js/hs-apexcharts-helpers.js"></script>
<script>
window.addEventListener('load', () => {
(function () {
buildChart('#hs-single-bar-chart', (mode) => ({
chart: {
type: 'bar',
height: 300,
toolbar: {
show: false
},
zoom: {
enabled: false
}
},
series: [
{
name: 'Sales',
data: [23000, 44000, 55000, 57000, 56000, 61000, 58000, 63000, 60000, 66000, 34000, 78000]
}
],
plotOptions: {
bar: {
horizontal: false,
columnWidth: '16px',
borderRadius: 0
}
},
legend: {
show: false
},
dataLabels: {
enabled: false
},
stroke: {
show: true,
width: 8,
colors: ['transparent']
},
xaxis: {
categories: [
'January',
'February',
'March',
'April',
'May',
'June',
'July',
'August',
'September',
'October',
'November',
'December'
],
axisBorder: {
show: false
},
axisTicks: {
show: false
},
crosshairs: {
show: false
},
labels: {
style: {
colors: '#9ca3af',
fontSize: '13px',
fontFamily: 'Inter, ui-sans-serif',
fontWeight: 400
},
offsetX: -2,
formatter: (title) => title.slice(0, 3)
}
},
yaxis: {
labels: {
align: 'left',
minWidth: 0,
maxWidth: 140,
style: {
colors: '#9ca3af',
fontSize: '13px',
fontFamily: 'Inter, ui-sans-serif',
fontWeight: 400
},
formatter: (value) => value >= 1000 ? `${value / 1000}k` : value
}
},
states: {
hover: {
filter: {
type: 'darken',
value: 0.9
}
}
},
tooltip: {
y: {
formatter: (value) => `$${value >= 1000 ? `${value / 1000}k` : value}`
},
custom: function (props) {
const { categories } = props.ctx.opts.xaxis;
const { dataPointIndex } = props;
const title = categories[dataPointIndex];
const newTitle = `${title}`;
return buildTooltip(props, {
title: newTitle,
mode,
hasTextLabel: true,
wrapperExtClasses: 'min-w-[120px]',
labelDivider: ':',
labelExtClasses: 'ms-2'
});
}
},
responsive: [{
breakpoint: 568,
options: {
chart: {
height: 300
},
plotOptions: {
bar: {
columnWidth: '14px'
}
},
stroke: {
width: 8
},
labels: {
style: {
colors: '#9ca3af',
fontSize: '11px',
fontFamily: 'Inter, ui-sans-serif',
fontWeight: 400
},
offsetX: -2,
formatter: (title) => title.slice(0, 3)
},
yaxis: {
labels: {
align: 'left',
minWidth: 0,
maxWidth: 140,
style: {
colors: '#9ca3af',
fontSize: '11px',
fontFamily: 'Inter, ui-sans-serif',
fontWeight: 400
},
formatter: (value) => value >= 1000 ? `${value / 1000}k` : value
}
},
},
}]
}), {
colors: ['#2563eb', '#d1d5db'],
grid: {
borderColor: '#e5e7eb'
}
}, {
colors: ['#3b82f6', '#2563eb'],
grid: {
borderColor: '#374151'
}
});
})();
});
</script>
<!-- Legend Indicator -->
<div class="flex justify-center sm:justify-end items-center gap-x-4 mb-3 sm:mb-6">
<div class="inline-flex items-center">
<span class="w-2.5 h-2.5 inline-block bg-blue-600 rounded-sm me-2"></span>
<span class="text-[13px] text-gray-600 dark:text-neutral-400">
Income
</span>
</div>
<div class="inline-flex items-center">
<span class="w-2.5 h-2.5 inline-block bg-gray-300 rounded-sm me-2"></span>
<span class="text-[13px] text-gray-600 dark:text-neutral-400">
Outcome
</span>
</div>
</div>
<!-- End Legend Indicator -->
<div id="hs-multiple-bar-charts"></div>
// Apexcharts build helpers
<script src="https://preline.co/assets/js/hs-apexcharts-helpers.js"></script>
<script>
window.addEventListener('load', () => {
(function () {
buildChart('#hs-multiple-bar-charts', (mode) => ({
chart: {
type: 'bar',
height: 300,
toolbar: {
show: false
},
zoom: {
enabled: false
}
},
series: [
{
name: 'Income',
data: [23000, 44000, 55000, 57000, 56000, 61000, 58000, 63000, 60000, 66000, 34000, 78000]
}, {
name: 'Outcome',
data: [17000, 76000, 85000, 101000, 98000, 87000, 105000, 91000, 114000, 94000, 67000, 66000]
}
],
plotOptions: {
bar: {
horizontal: false,
columnWidth: '16px',
borderRadius: 0
}
},
legend: {
show: false
},
dataLabels: {
enabled: false
},
stroke: {
show: true,
width: 8,
colors: ['transparent']
},
xaxis: {
categories: [
'January',
'February',
'March',
'April',
'May',
'June',
'July',
'August',
'September',
'October',
'November',
'December'
],
axisBorder: {
show: false
},
axisTicks: {
show: false
},
crosshairs: {
show: false
},
labels: {
style: {
colors: '#9ca3af',
fontSize: '13px',
fontFamily: 'Inter, ui-sans-serif',
fontWeight: 400
},
offsetX: -2,
formatter: (title) => title.slice(0, 3)
}
},
yaxis: {
labels: {
align: 'left',
minWidth: 0,
maxWidth: 140,
style: {
colors: '#9ca3af',
fontSize: '13px',
fontFamily: 'Inter, ui-sans-serif',
fontWeight: 400
},
formatter: (value) => value >= 1000 ? `${value / 1000}k` : value
}
},
states: {
hover: {
filter: {
type: 'darken',
value: 0.9
}
}
},
tooltip: {
y: {
formatter: (value) => `$${value >= 1000 ? `${value / 1000}k` : value}`
},
custom: function (props) {
const { categories } = props.ctx.opts.xaxis;
const { dataPointIndex } = props;
const title = categories[dataPointIndex];
const newTitle = `${title}`;
return buildTooltip(props, {
title: newTitle,
mode,
hasTextLabel: true,
wrapperExtClasses: 'min-w-[120px]',
labelDivider: ':',
labelExtClasses: 'ms-2'
});
}
},
responsive: [{
breakpoint: 568,
options: {
chart: {
height: 300
},
plotOptions: {
bar: {
columnWidth: '14px'
}
},
stroke: {
width: 8
},
labels: {
style: {
colors: '#9ca3af',
fontSize: '11px',
fontFamily: 'Inter, ui-sans-serif',
fontWeight: 400
},
offsetX: -2,
formatter: (title) => title.slice(0, 3)
},
yaxis: {
labels: {
align: 'left',
minWidth: 0,
maxWidth: 140,
style: {
colors: '#9ca3af',
fontSize: '11px',
fontFamily: 'Inter, ui-sans-serif',
fontWeight: 400
},
formatter: (value) => value >= 1000 ? `${value / 1000}k` : value
}
},
},
}]
}), {
colors: ['#2563eb', '#d1d5db'],
grid: {
borderColor: '#e5e7eb'
}
}, {
colors: ['#6b7280', '#2563eb'],
grid: {
borderColor: '#374151'
}
});
})();
});
</script>
<!-- Apex Lines Chart -->
<div id="hs-single-line-chart"></div>
// Apexcharts build helpers
<script src="https://preline.co/assets/js/hs-apexcharts-helpers.js"></script>
<script>
window.addEventListener('load', () => {
(function () {
buildChart('#hs-single-line-chart', (mode) => ({
chart: {
height: 250,
type: 'line',
toolbar: {
show: false
},
zoom: {
enabled: false
}
},
series: [
{
name: 'Sales',
data: [0, 27000, 25000, 27000, 40000]
}
],
dataLabels: {
enabled: false
},
stroke: {
curve: 'straight',
width: [4, 4, 4],
dashArray: [0, 0, 4]
},
title: {
show: false
},
legend: {
show: false
},
grid: {
strokeDashArray: 0,
borderColor: '#e5e7eb',
padding: {
top: -20,
right: 0
}
},
xaxis: {
type: 'category',
categories: [
'25 January 2023',
'28 January 2023',
'31 January 2023',
'1 February 2023',
'3 February 2023'
],
axisBorder: {
show: false
},
axisTicks: {
show: false
},
tooltip: {
enabled: false
},
labels: {
offsetY: 5,
style: {
colors: '#9ca3af',
fontSize: '13px',
fontFamily: 'Inter, ui-sans-serif',
fontWeight: 400
},
formatter: (title) => {
let t = title;
if (t) {
const newT = t.split(' ');
t = `${newT[0]} ${newT[1].slice(0, 3)}`;
}
return t;
}
}
},
yaxis: {
min: 0,
max: 40000,
tickAmount: 4,
labels: {
align: 'left',
minWidth: 0,
maxWidth: 140,
style: {
colors: '#9ca3af',
fontSize: '12px',
fontFamily: 'Inter, ui-sans-serif',
fontWeight: 400
},
formatter: (value) => value >= 1000 ? `${value / 1000}k` : value
}
},
tooltip: {
custom: function (props) {
const { categories } = props.ctx.opts.xaxis;
const { dataPointIndex } = props;
const title = categories[dataPointIndex].split(' ');
const newTitle = `${title[0]} ${title[1]}`;
return buildTooltip(props, {
title: newTitle,
mode,
hasTextLabel: true,
wrapperExtClasses: 'min-w-[120px]',
labelDivider: ':',
labelExtClasses: 'ms-2'
});
}
}
}), {
colors: ['#2563EB', '#22d3ee', '#d1d5db'],
grid: {
borderColor: '#e5e7eb'
}
}, {
colors: ['#3b82f6', '#22d3ee', '#6b7280'],
grid: {
borderColor: '#374151'
}
});
})();
});
</script>
<!-- Legend Indicator -->
<div class="flex justify-center sm:justify-end items-center gap-x-4 mb-3 sm:mb-6">
<div class="inline-flex items-center">
<span class="w-2.5 h-2.5 inline-block bg-blue-600 rounded-sm me-2"></span>
<span class="text-[13px] text-gray-600 dark:text-neutral-400">
Income
</span>
</div>
<div class="inline-flex items-center">
<span class="w-2.5 h-2.5 inline-block bg-cyan-500 rounded-sm me-2"></span>
<span class="text-[13px] text-gray-600 dark:text-neutral-400">
Outcome
</span>
</div>
<div class="inline-flex items-center">
<span class="w-2.5 h-2.5 inline-block bg-gray-300 rounded-sm me-2"></span>
<span class="text-[13px] text-gray-600 dark:text-neutral-400">
Others
</span>
</div>
</div>
<!-- End Legend Indicator -->
<!-- Apex Lines Chart -->
<div id="hs-multiple-line-charts"></div>
// Apexcharts build helpers
<script src="https://preline.co/assets/js/hs-apexcharts-helpers.js"></script>
<script>
window.addEventListener('load', () => {
(function () {
buildChart('#hs-multiple-line-charts', (mode) => ({
chart: {
height: 250,
type: 'line',
toolbar: {
show: false
},
zoom: {
enabled: false
}
},
series: [
{
name: 'Income',
data: [0, 27000, 25000, 27000, 40000]
},
{
name: 'Outcome',
data: [19500, 10000, 19000, 17500, 26000]
},
{
name: 'Others',
data: [8000, 2200, 6000, 9000, 10000]
}
],
dataLabels: {
enabled: false
},
stroke: {
curve: 'straight',
width: [4, 4, 4],
dashArray: [0, 0, 4]
},
title: {
show: false
},
legend: {
show: false
},
grid: {
strokeDashArray: 0,
borderColor: '#e5e7eb',
padding: {
top: -20,
right: 0
}
},
xaxis: {
type: 'category',
categories: [
'25 January 2023',
'28 January 2023',
'31 January 2023',
'1 February 2023',
'3 February 2023'
],
axisBorder: {
show: false
},
axisTicks: {
show: false
},
tooltip: {
enabled: false
},
labels: {
offsetY: 5,
style: {
colors: '#9ca3af',
fontSize: '13px',
fontFamily: 'Inter, ui-sans-serif',
fontWeight: 400
},
formatter: (title) => {
let t = title;
if (t) {
const newT = t.split(' ');
t = `${newT[0]} ${newT[1].slice(0, 3)}`;
}
return t;
}
}
},
yaxis: {
min: 0,
max: 40000,
tickAmount: 4,
labels: {
align: 'left',
minWidth: 0,
maxWidth: 140,
style: {
colors: '#9ca3af',
fontSize: '12px',
fontFamily: 'Inter, ui-sans-serif',
fontWeight: 400
},
formatter: (value) => value >= 1000 ? `${value / 1000}k` : value
}
},
tooltip: {
custom: function (props) {
const { categories } = props.ctx.opts.xaxis;
const { dataPointIndex } = props;
const title = categories[dataPointIndex].split(' ');
const newTitle = `${title[0]} ${title[1]}`;
return buildTooltip(props, {
title: newTitle,
mode,
hasTextLabel: true,
wrapperExtClasses: 'min-w-[150px]',
labelDivider: ':',
labelExtClasses: 'ms-2'
});
}
}
}), {
colors: ['#2563EB', '#22d3ee', '#d1d5db'],
grid: {
borderColor: '#e5e7eb'
}
}, {
colors: ['#3b82f6', '#22d3ee', '#6b7280'],
grid: {
borderColor: '#374151'
}
});
})();
});
</script>
Use curve: 'smooth'
to make the chart lines curved.
<!-- Legend Indicator -->
<div class="flex justify-center sm:justify-end items-center gap-x-4 mb-3 sm:mb-6">
<div class="inline-flex items-center">
<span class="w-2.5 h-2.5 inline-block bg-blue-600 rounded-sm me-2"></span>
<span class="text-[13px] text-gray-600 dark:text-neutral-400">
Income
</span>
</div>
<div class="inline-flex items-center">
<span class="w-2.5 h-2.5 inline-block bg-cyan-500 rounded-sm me-2"></span>
<span class="text-[13px] text-gray-600 dark:text-neutral-400">
Outcome
</span>
</div>
<div class="inline-flex items-center">
<span class="w-2.5 h-2.5 inline-block bg-gray-300 rounded-sm me-2"></span>
<span class="text-[13px] text-gray-600 dark:text-neutral-400">
Others
</span>
</div>
</div>
<!-- End Legend Indicator -->
<!-- Apex Lines Chart -->
<div id="hs-curved-line-charts"></div>
// Apexcharts build helpers
<script src="https://preline.co/assets/js/hs-apexcharts-helpers.js"></script>
<script>
window.addEventListener('load', () => {
(function () {
buildChart('#hs-curved-line-charts', (mode) => ({
chart: {
height: 250,
type: 'line',
toolbar: {
show: false
},
zoom: {
enabled: false
}
},
series: [
{
name: 'Income',
data: [0, 27000, 25000, 27000, 40000]
},
{
name: 'Outcome',
data: [19500, 10000, 19000, 17500, 26000]
},
{
name: 'Others',
data: [8000, 2200, 6000, 9000, 10000]
}
],
dataLabels: {
enabled: false
},
stroke: {
curve: 'smooth',
width: [4, 4, 4],
dashArray: [0, 0, 4]
},
title: {
show: false
},
legend: {
show: false
},
grid: {
strokeDashArray: 0,
borderColor: '#e5e7eb',
padding: {
top: -20,
right: 0
}
},
xaxis: {
type: 'category',
categories: [
'25 January 2023',
'28 January 2023',
'31 January 2023',
'1 February 2023',
'3 February 2023'
],
axisBorder: {
show: false
},
axisTicks: {
show: false
},
tooltip: {
enabled: false
},
labels: {
offsetY: 5,
style: {
colors: '#9ca3af',
fontSize: '13px',
fontFamily: 'Inter, ui-sans-serif',
fontWeight: 400
},
formatter: (title) => {
let t = title;
if (t) {
const newT = t.split(' ');
t = `${newT[0]} ${newT[1].slice(0, 3)}`;
}
return t;
}
}
},
yaxis: {
min: 0,
max: 40000,
tickAmount: 4,
labels: {
align: 'left',
minWidth: 0,
maxWidth: 140,
style: {
colors: '#9ca3af',
fontSize: '12px',
fontFamily: 'Inter, ui-sans-serif',
fontWeight: 400
},
formatter: (value) => value >= 1000 ? `${value / 1000}k` : value
}
},
tooltip: {
custom: function (props) {
const { categories } = props.ctx.opts.xaxis;
const { dataPointIndex } = props;
const title = categories[dataPointIndex].split(' ');
const newTitle = `${title[0]} ${title[1]}`;
return buildTooltip(props, {
title: newTitle,
mode,
hasTextLabel: true,
wrapperExtClasses: 'min-w-[150px]',
labelDivider: ':',
labelExtClasses: 'ms-2'
});
}
}
}), {
colors: ['#2563EB', '#22d3ee', '#d1d5db'],
grid: {
borderColor: '#e5e7eb'
}
}, {
colors: ['#3b82f6', '#22d3ee', '#6b7280'],
grid: {
borderColor: '#374151'
}
});
})();
});
</script>
<div id="hs-horizontal-bar-chart"></div>
// Apexcharts build helpers
<script src="https://preline.co/assets/js/hs-apexcharts-helpers.js"></script>
<script>
window.addEventListener('load', () => {
(function () {
buildChart('#hs-horizontal-bar-chart', (mode) => ({
chart: {
type: 'bar',
height: 300,
toolbar: {
show: false
},
zoom: {
enabled: false
}
},
series: [
{
name: 'Sales',
data: [23000, 44000, 55000, 57000, 56000, 61000, 58000, 63000, 60000, 66000, 34000, 78000]
}
],
plotOptions: {
bar: {
horizontal: true,
columnWidth: '16px',
borderRadius: 0
}
},
legend: {
show: false
},
dataLabels: {
enabled: false
},
stroke: {
show: true,
width: 2,
colors: ['transparent']
},
xaxis: {
categories: [
'January',
'February',
'March',
'April',
'May',
'June',
'July',
'August',
'September',
'October',
'November',
'December'
],
crosshairs: {
show: false
},
labels: {
style: {
colors: '#9ca3af',
fontSize: '13px',
fontFamily: 'Inter, ui-sans-serif',
fontWeight: 400
},
offsetX: -2,
formatter: (value) => value >= 1000 ? `${value / 1000}k` : value
}
},
yaxis: {
crosshairs: {
show: false
},
labels: {
align: 'left',
minWidth: 0,
maxWidth: 140,
style: {
colors: '#9ca3af',
fontSize: '13px',
fontFamily: 'Inter, ui-sans-serif',
fontWeight: 400
},
offsetX: -10,
formatter: (title) => typeof title === 'string' ? title.slice(0, 3) : title
}
},
states: {
hover: {
filter: {
type: 'darken',
value: 0.9
}
}
},
tooltip: {
y: {
formatter: (value) => `$${value >= 1000 ? `${value / 1000}k` : value}`
},
custom: function (props) {
const { categories } = props.ctx.opts.xaxis;
const { dataPointIndex } = props;
const title = categories[dataPointIndex];
const newTitle = `${title}`;
return buildTooltip(props, {
title: newTitle,
mode,
hasTextLabel: true,
wrapperExtClasses: 'min-w-[120px]',
labelDivider: ':',
labelExtClasses: 'ms-2'
});
}
}
}), {
colors: ['#2563eb'],
grid: {
borderColor: '#e5e7eb'
}
}, {
colors: ['#3b82f6'],
grid: {
borderColor: '#374151'
}
});
})();
});
</script>
<div class="flex flex-col justify-center items-center">
<div id="hs-donut-chart"></div>
<!-- Legend Indicator -->
<div class="flex justify-center sm:justify-end items-center gap-x-4 mt-3 sm:mt-6">
<div class="inline-flex items-center">
<span class="w-2.5 h-2.5 inline-block bg-blue-600 rounded-sm me-2"></span>
<span class="text-[13px] text-gray-600 dark:text-neutral-400">
Income
</span>
</div>
<div class="inline-flex items-center">
<span class="w-2.5 h-2.5 inline-block bg-cyan-500 rounded-sm me-2"></span>
<span class="text-[13px] text-gray-600 dark:text-neutral-400">
Outcome
</span>
</div>
<div class="inline-flex items-center">
<span class="w-2.5 h-2.5 inline-block bg-gray-300 rounded-sm me-2"></span>
<span class="text-[13px] text-gray-600 dark:text-neutral-400">
Others
</span>
</div>
</div>
<!-- End Legend Indicator -->
</div>
// Apexcharts build helpers
<script src="https://preline.co/assets/js/hs-apexcharts-helpers.js"></script>
<script>
window.addEventListener('load', () => {
(function () {
buildChart('#hs-donut-chart', () => ({
chart: {
height: 230,
width: 230,
type: 'donut',
zoom: {
enabled: false
}
},
plotOptions: {
pie: {
donut: {
size: '76%'
}
}
},
series: [47, 23, 30],
labels: ['Tailwind CSS', 'Preline UI', 'Others'],
legend: {
show: false
},
dataLabels: {
enabled: false
},
stroke: {
width: 5
},
grid: {
padding: {
top: -12,
bottom: -11,
left: -12,
right: -12
}
},
states: {
hover: {
filter: {
type: 'none'
}
}
}
}), {
colors: ['#3b82f6', '#22d3ee', '#e5e7eb'],
stroke: {
colors: ['rgb(255, 255, 255)']
}
}, {
colors: ['#e5e7eb', '#3b82f6', '#22d3ee'],
stroke: {
colors: ['rgb(38, 38, 38)']
}
});
})();
});
</script>
<div class="flex flex-col justify-center items-center h-[340px]">
<div id="hs-bubble-chart"></div>
<!-- Legend Indicator -->
<div class="flex justify-center sm:justify-end items-center gap-x-4">
<div class="inline-flex items-center">
<span class="w-2.5 h-2.5 inline-block bg-blue-600 rounded-sm me-2"></span>
<span class="text-[13px] text-gray-600 dark:text-neutral-400">
Income
</span>
</div>
<div class="inline-flex items-center">
<span class="w-2.5 h-2.5 inline-block bg-cyan-500 rounded-sm me-2"></span>
<span class="text-[13px] text-gray-600 dark:text-neutral-400">
Outcome
</span>
</div>
<div class="inline-flex items-center">
<span class="w-2.5 h-2.5 inline-block bg-gray-300 rounded-sm me-2"></span>
<span class="text-[13px] text-gray-600 dark:text-neutral-400">
Others
</span>
</div>
</div>
<!-- End Legend Indicator -->
</div>
// Apexcharts build helpers
<script src="https://preline.co/assets/js/hs-apexcharts-helpers.js"></script>
<script>
window.addEventListener('load', () => {
(function () {
buildChart('#hs-bubble-chart', () => ({
chart: {
height: '100%',
type: 'bubble',
toolbar: {
show: false
},
zoom: {
enabled: false
}
},
series: [
{data: [[5, 6, 70]]},
{data: [[8, 4, 45]]},
{data: [[10, 9, 90]]}
],
dataLabels: {
style: {
fontSize: '20px',
fontFamily: 'Inter, ui-sans-serif',
fontWeight: '400',
colors: ['#fff', '#1f2937', '#fff']
},
formatter: (value) => `${value}%`
},
fill: {
opacity: 1
},
legend: {
show: false
},
stroke: {
width: 5
},
plotOptions: {
bubble: {
zScaling: false,
minBubbleRadius: 40
}
},
grid: {
show: false,
padding: {
top: 0,
bottom: 0,
left: 0,
right: 0
}
},
xaxis: {
min: 0,
max: 15,
labels: {
show: false
},
axisBorder: {
show: false
},
axisTicks: {
show: false
}
},
yaxis: {
min: 0,
max: 15,
labels: {
show: false
}
},
tooltip: {
enabled: false
},
states: {
hover: {
filter: {
type: 'none'
}
}
}
}), {
colors: ['#22d3ee','#e5e7eb', '#3b82f6'],
markers: {
strokeColors: 'rgb(255, 255, 255)'
}
}, {
colors: ['#3b82f6', '#22d3ee', '#e5e7eb'],
markers: {
strokeColors: 'rgb(38, 38, 38)'
}
});
})();
});
</script>
<div class="p-4">
<div class="flex flex-col justify-center items-center h-[300px]">
<div id="hs-pie-chart"></div>
<!-- Legend Indicator -->
<div class="flex justify-center sm:justify-end items-center gap-x-4 mt-3 sm:mt-6">
<div class="inline-flex items-center">
<span class="w-2.5 h-2.5 inline-block bg-blue-600 rounded-sm me-2"></span>
<span class="text-[13px] text-gray-600 dark:text-neutral-400">
Income
</span>
</div>
<div class="inline-flex items-center">
<span class="w-2.5 h-2.5 inline-block bg-cyan-500 rounded-sm me-2"></span>
<span class="text-[13px] text-gray-600 dark:text-neutral-400">
Outcome
</span>
</div>
<div class="inline-flex items-center">
<span class="w-2.5 h-2.5 inline-block bg-gray-300 rounded-sm me-2"></span>
<span class="text-[13px] text-gray-600 dark:text-neutral-400">
Others
</span>
</div>
</div>
<!-- End Legend Indicator -->
</div>
</div>
// Apexcharts build helpers
<script src="https://preline.co/assets/js/hs-apexcharts-helpers.js"></script>
<script>
window.addEventListener('load', () => {
(function () {
buildChart('#hs-pie-chart', () => ({
chart: {
height: '100%',
type: 'pie',
zoom: {
enabled: false
}
},
series: [70, 18, 12],
labels: ['Direct', 'Organic search', 'Referral'],
title: {
show: false
},
dataLabels: {
style: {
fontSize: '20px',
fontFamily: 'Inter, ui-sans-serif',
fontWeight: '400',
colors: ['#fff', '#fff', '#1f2937']
},
dropShadow: {
enabled: false
},
formatter: (value) => `${value.toFixed(1)} %`
},
plotOptions: {
pie: {
dataLabels: {
offset: -15
}
}
},
legend: {
show: false
},
stroke: {
width: 4
},
grid: {
padding: {
top: -10,
bottom: -14,
left: -9,
right: -9
}
},
tooltip: {
enabled: false
},
states: {
hover: {
filter: {
type: 'none'
}
}
}
}), {
colors: ['#3b82f6', '#22d3ee', '#e5e7eb'],
stroke: {
colors: ['rgb(255, 255, 255)']
}
}, {
colors: ['#22d3ee', '#3b82f6', '#e5e7eb'],
stroke: {
colors: ['rgb(38, 38, 38)']
}
});
})();
});
</script>
<!-- List Group -->
<ul class="flex flex-col">
<li class="py-3 px-4 text-sm font-semibold bg-gray-50 border text-gray-800 -mt-px first:rounded-t-lg first:mt-0 last:rounded-b-lg dark:bg-slate-800 dark:border-gray-700 dark:text-gray-200">
<div class="grid grid-cols-2 items-center gap-x-2">
<span>Chart</span>
<span>Types</span>
</div>
</li>
<li class="py-3 px-4 text-sm border text-gray-800 -mt-px first:rounded-t-lg first:mt-0 last:rounded-b-lg dark:border-gray-700 dark:text-gray-200">
<div class="grid grid-cols-2 items-center gap-x-2">
<div id="hs-sparklines-area-chart"></div>
<span>Inline area chart</span>
</div>
</li>
<li class="py-3 px-4 text-sm border text-gray-800 -mt-px first:rounded-t-lg first:mt-0 last:rounded-b-lg dark:border-gray-700 dark:text-gray-200">
<div class="grid grid-cols-2 items-center gap-x-2">
<div id="hs-sparklines-bar-chart"></div>
<span>Inline bar chart</span>
</div>
</li>
<li class="py-3 px-4 text-sm border text-gray-800 -mt-px first:rounded-t-lg first:mt-0 last:rounded-b-lg dark:border-gray-700 dark:text-gray-200">
<div class="grid grid-cols-2 items-center gap-x-2">
<div id="hs-sparklines-pie-chart"></div>
<span>Inline pie chart</span>
</div>
</li>
<li class="py-3 px-4 text-sm border text-gray-800 -mt-px first:rounded-t-lg first:mt-0 last:rounded-b-lg dark:border-gray-700 dark:text-gray-200">
<div class="grid grid-cols-2 items-center gap-x-2">
<div id="hs-sparklines-line-chart"></div>
<span>Inline line chart</span>
</div>
</li>
<li class="py-3 px-4 text-sm border text-gray-800 -mt-px first:rounded-t-lg first:mt-0 last:rounded-b-lg dark:border-gray-700 dark:text-gray-200">
<div class="grid grid-cols-2 items-center gap-x-2">
<div id="hs-sparklines-candles-chart"></div>
<span>Inline candles chart</span>
</div>
</li>
</ul>
<!-- End List Group -->
// Apexcharts build helpers
<script src="https://preline.co/assets/js/hs-apexcharts-helpers.js"></script>
<script>
window.addEventListener('load', () => {
(function () {
buildChart('#hs-sparklines-area-chart', (mode) => ({
series: [{
name: 'Sales',
data: [21,20,24,45,47,30,30,35,35,35,40]
}],
chart: {
width: 100,
height: 30,
type: 'area',
sparkline: {
enabled: true
}
},
stroke: {
curve: 'smooth',
width: 0
},
fill: {
type: 'solid'
},
xaxis: {
type: 'category',
categories: [
'25 January 2023',
'26 January 2023',
'27 January 2023',
'28 January 2023',
'29 January 2023',
'30 January 2023',
'31 January 2023',
'1 February 2023',
'2 February 2023',
'3 February 2023',
'4 February 2023'
],
crosshairs: {
show: false
}
},
markers: {
hover: {
size: 0
}
},
tooltip: {
marker: {
show: false
},
fixed: {
enabled: true,
position: 'bottomLeft',
offsetX: 10,
offsetY: -15,
},
custom: function (props) {
const { categories } = props.ctx.opts.xaxis;
const { dataPointIndex } = props;
const title = categories[dataPointIndex].split(' ');
const newTitle = `${title[0]} ${title[1]}`;
return buildTooltip(props, {
title: newTitle,
mode,
hasTextLabel: true,
wrapperExtClasses: 'min-w-[120px]',
titleExtClasses: 'text-left',
labelDivider: ':',
labelExtClasses: 'ms-2'
});
}
}
}), {
colors: ['#2563eb'],
grid: {
borderColor: '#e5e7eb'
}
}, {
colors: ['#3b82f6'],
grid: {
borderColor: '#374151'
}
});
})();
(function () {
buildChart('#hs-sparklines-bar-chart', (mode) => ({
series: [{
name: 'Sales',
data: [21,20,24,45,47,30,30,-35,-45,35,40]
}],
chart: {
width: 100,
height: 50,
type: 'bar',
sparkline: {
enabled: true
}
},
xaxis: {
type: 'category',
categories: [
'25 January 2023',
'26 January 2023',
'27 January 2023',
'28 January 2023',
'29 January 2023',
'30 January 2023',
'31 January 2023',
'1 February 2023',
'2 February 2023',
'3 February 2023',
'4 February 2023'
],
crosshairs: {
show: false
}
},
tooltip: {
marker: {
show: false
},
fixed: {
enabled: true,
position: 'bottomLeft',
offsetX: 10,
offsetY: -15,
},
custom: function (props) {
const { categories } = props.ctx.opts.xaxis;
const { dataPointIndex } = props;
const title = categories[dataPointIndex].split(' ');
const newTitle = `${title[0]} ${title[1]}`;
return buildTooltip(props, {
title: newTitle,
mode,
hasTextLabel: true,
wrapperExtClasses: 'min-w-[120px]',
titleExtClasses: 'text-left',
labelDivider: ':',
labelExtClasses: 'ms-2'
});
}
}
}), {
colors: ['#3b82f6'],
plotOptions: {
bar: {
colors: {
ranges: [{
from: -45,
to: 0,
color: '#e5e7eb'
}]
}
}
},
grid: {
borderColor: '#e5e7eb'
}
}, {
colors: ['#3b82f6'],
plotOptions: {
bar: {
colors: {
ranges: [{
from: -45,
to: 0,
color: '#ffffff'
}]
}
}
},
grid: {
borderColor: '#374151'
}
});
})();
(function () {
buildChart('#hs-sparklines-pie-chart', () => ({
chart: {
width: 30,
height: 30,
type: 'pie',
sparkline: {
enabled: true
}
},
series: [70, 18, 12],
labels: ['Direct', 'Organic search', 'Referral'],
plotOptions: {
pie: {
expandOnClick: false
}
},
stroke: {
width: 0
},
tooltip: {
enabled: false
},
states: {
hover: {
filter: {
type: 'none'
}
}
}
}), {
colors: ['#3b82f6', '#22d3ee', '#e5e7eb'],
stroke: {
colors: ['rgb(255, 255, 255)']
}
}, {
colors: ['#22d3ee', '#3b82f6', '#e5e7eb'],
stroke: {
colors: ['rgb(38, 38, 38)']
}
});
})();
(function () {
buildChart('#hs-sparklines-line-chart', (mode) => ({
series: [{
name: 'Sales',
data: [21,20,24,45,47,30,30,35,35,35,40]
}],
chart: {
width: 100,
height: 30,
type: 'line',
sparkline: {
enabled: true
}
},
stroke: {
curve: 'smooth',
width: 2
},
xaxis: {
type: 'category',
categories: [
'25 January 2023',
'26 January 2023',
'27 January 2023',
'28 January 2023',
'29 January 2023',
'30 January 2023',
'31 January 2023',
'1 February 2023',
'2 February 2023',
'3 February 2023',
'4 February 2023'
],
crosshairs: {
show: false
},
},
markers: {
hover: {
size: 0
}
},
tooltip: {
marker: {
show: false
},
fixed: {
enabled: true,
position: 'bottomLeft',
offsetX: 10,
offsetY: -15,
},
custom: function (props) {
const { categories } = props.ctx.opts.xaxis;
const { dataPointIndex } = props;
const title = categories[dataPointIndex].split(' ');
const newTitle = `${title[0]} ${title[1]}`;
return buildTooltip(props, {
title: newTitle,
mode,
hasTextLabel: true,
wrapperExtClasses: 'min-w-[120px]',
titleExtClasses: 'text-left',
labelDivider: ':',
labelExtClasses: 'ms-2'
});
}
}
}), {
colors: ['#3b82f6']
}, {
colors: ['#3b82f6']
});
})();
(function () {
buildChart('#hs-sparklines-candles-chart', (mode) => ({
series: [{
name: 'Sales',
data: [{
x: '25 January 2023',
y: [6598.86, 6598.88, 6570, 6587.16]
}, {
x: '26 January 2023',
y: [6588.86, 6600, 6580, 6593.4]
}, {
x: '27 January 2023',
y: [6593.99, 6598.89, 6585, 6587.81]
}, {
x: '28 January 2023',
y: [6587.81, 6592.73, 6567.14, 6578]
}, {
x: '29 January 2023',
y: [6578.35, 6581.72, 6567.39, 6579]
}, {
x: '30 January 2023',
y: [6579.38, 6580.92, 6566.77, 6575.96]
}, {
x: '31 January 2023',
y: [6575.96, 6589, 6571.77, 6588.92]
}, {
x: '1 February 2023',
y: [6588.92, 6594, 6577.55, 6589.22]
}, {
x: '2 February 2023',
y: [6589.3, 6598.89, 6589.1, 6596.08]
}, {
x: '3 February 2023',
y: [6597.5, 6600, 6588.39, 6596.25]
}, {
x: '4 February 2023',
y: [6598.03, 6600, 6588.73, 6595.97]
}]
}],
chart: {
width: 100,
height: 50,
type: 'candlestick',
sparkline: {
enabled: true
}
},
xaxis: {
type: 'category',
categories: [
'25 January 2023',
'26 January 2023',
'27 January 2023',
'28 January 2023',
'29 January 2023',
'30 January 2023',
'31 January 2023',
'1 February 2023',
'2 February 2023',
'3 February 2023',
'4 February 2023'
],
crosshairs: {
show: false
},
},
tooltip: {
marker: {
show: false
},
fixed: {
enabled: true,
position: 'bottomLeft',
offsetX: 10,
offsetY: -15,
},
custom: function (props) {
const { categories } = props.ctx.opts.xaxis;
const { dataPointIndex } = props;
const title = categories[dataPointIndex].split(' ');
const newTitle = `${title[0]} ${title[1]}`;
return buildTooltip(props, {
title: newTitle,
mode,
hasTextLabel: true,
wrapperExtClasses: 'min-w-[120px]',
titleExtClasses: 'text-left',
labelDivider: ':',
labelExtClasses: 'ms-2'
});
}
}
}), {
colors: ['#3b82f6'],
plotOptions: {
candlestick: {
colors: {
upward: '#3b82f6',
downward: '#3b82f6'
}
}
}
}, {
colors: ['#3b82f6'],
plotOptions: {
candlestick: {
colors: {
upward: '#3b82f6',
downward: '#3b82f6'
}
}
}
});
})();
});
</script>